Visualizing World Development Indicators
20 Jun 2015Fetching Data from World Bank
The Package WDI (world development indicators) is used to fetch data from WDI.
We can search the data as follow:
# Load required libraries
library('WDI')
library(ggplot2)

# Search
WDIsearch(string = 'GDP per capita')
## indicator
## [1,] "GDPPCKD"
## [2,] "GDPPCKN"
## [3,] "NV.AGR.PCAP.KD.ZG"
## [4,] "NY.GDP.PCAP.CD"
## [5,] "NY.GDP.PCAP.KD"
## [6,] "NY.GDP.PCAP.KD.ZG"
## [7,] "NY.GDP.PCAP.KN"
## [8,] "NY.GDP.PCAP.PP.CD"
## [9,] "NY.GDP.PCAP.PP.KD"
## [10,] "NY.GDP.PCAP.PP.KD.ZG"
## [11,] "SE.XPD.PRIM.PC.ZS"
## [12,] "SE.XPD.SECO.PC.ZS"
## [13,] "SE.XPD.TERT.PC.ZS"
## name
## [1,] "GDP per Capita, constant US$, millions"
## [2,] "Real GDP per Capita (real local currency units, various base years)"
## [3,] "Real agricultural GDP per capita growth rate (%)"
## [4,] "GDP per capita (current US$)"
## [5,] "GDP per capita (constant 2000 US$)"
## [6,] "GDP per capita growth (annual %)"
## [7,] "GDP per capita (constant LCU)"
## [8,] "GDP per capita, PPP (current international $)"
## [9,] "GDP per capita, PPP (constant 2005 international $)"
## [10,] "GDP per capita, PPP annual growth (%)"
## [11,] "Expenditure per student, primary (% of GDP per capita)"
## [12,] "Expenditure per student, secondary (% of GDP per capita)"
## [13,] "Expenditure per student, tertiary (% of GDP per capita)"Visualizing GDP per capita
Below we import the data on GDP per capita from years 1980 to 2013 from some countries and we show a simple plot of it: GDP per capita (constant 2000 US$).
dat <- WDI(indicator = c("NY.GDP.PCAP.KD"),
           country = c("PT","ES", "US", "EU", "BR"),
           start = 1980, end = 2013)
#
ggplot(dat, aes(year, NY.GDP.PCAP.KD, color = country)) +
    geom_line() + geom_point() +
    labs(x = "year", y = "GDP per capita") +
    ggtitle("GDP per capita by Country (constant 2000 US$)")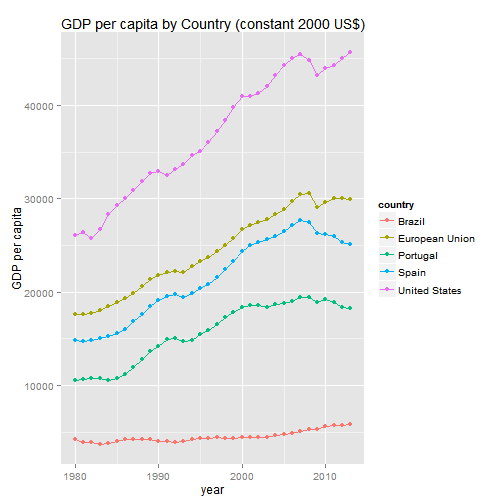
References
- [Fetching Public Data With R] (http://rstudio-pubs-static.s3.amazonaws.com/24858_1f006c3965614b0099c963913100e9f0.html)
- [http://markuskainu.fi/workshop/data_analyysi/workshop.html] (http://markuskainu.fi/workshop/data_analyysi/workshop.html)
- [http://cran.r-project.org/web/packages/WDI/index.html] (http://cran.r-project.org/web/packages/WDI/index.html)